The latest Mria CRM release introduces a Sales Dashboard, giving teams a clear view of pipeline state, sales performance, and revenue outcomes inside Jira.
Built on Mria CRM data, the Dashboard brings together key CRM metrics, pipeline funnels, revenue trends, and comparison tools in one place. It helps sales teams, managers, and leadership understand how the sales system is performing without reviewing individual records or exporting data to external tools.
Mria CRM Dashboard Overview: A Single Screen That Explains the Sales System
The Dashboard in Mria CRM is designed to answer one practical question:
“If I look at this screen for two minutes, do I understand how our sales system is doing?”
- first, a high-level snapshot
- then, structure and distribution
- finally, movement over time
Each section builds on the previous one.
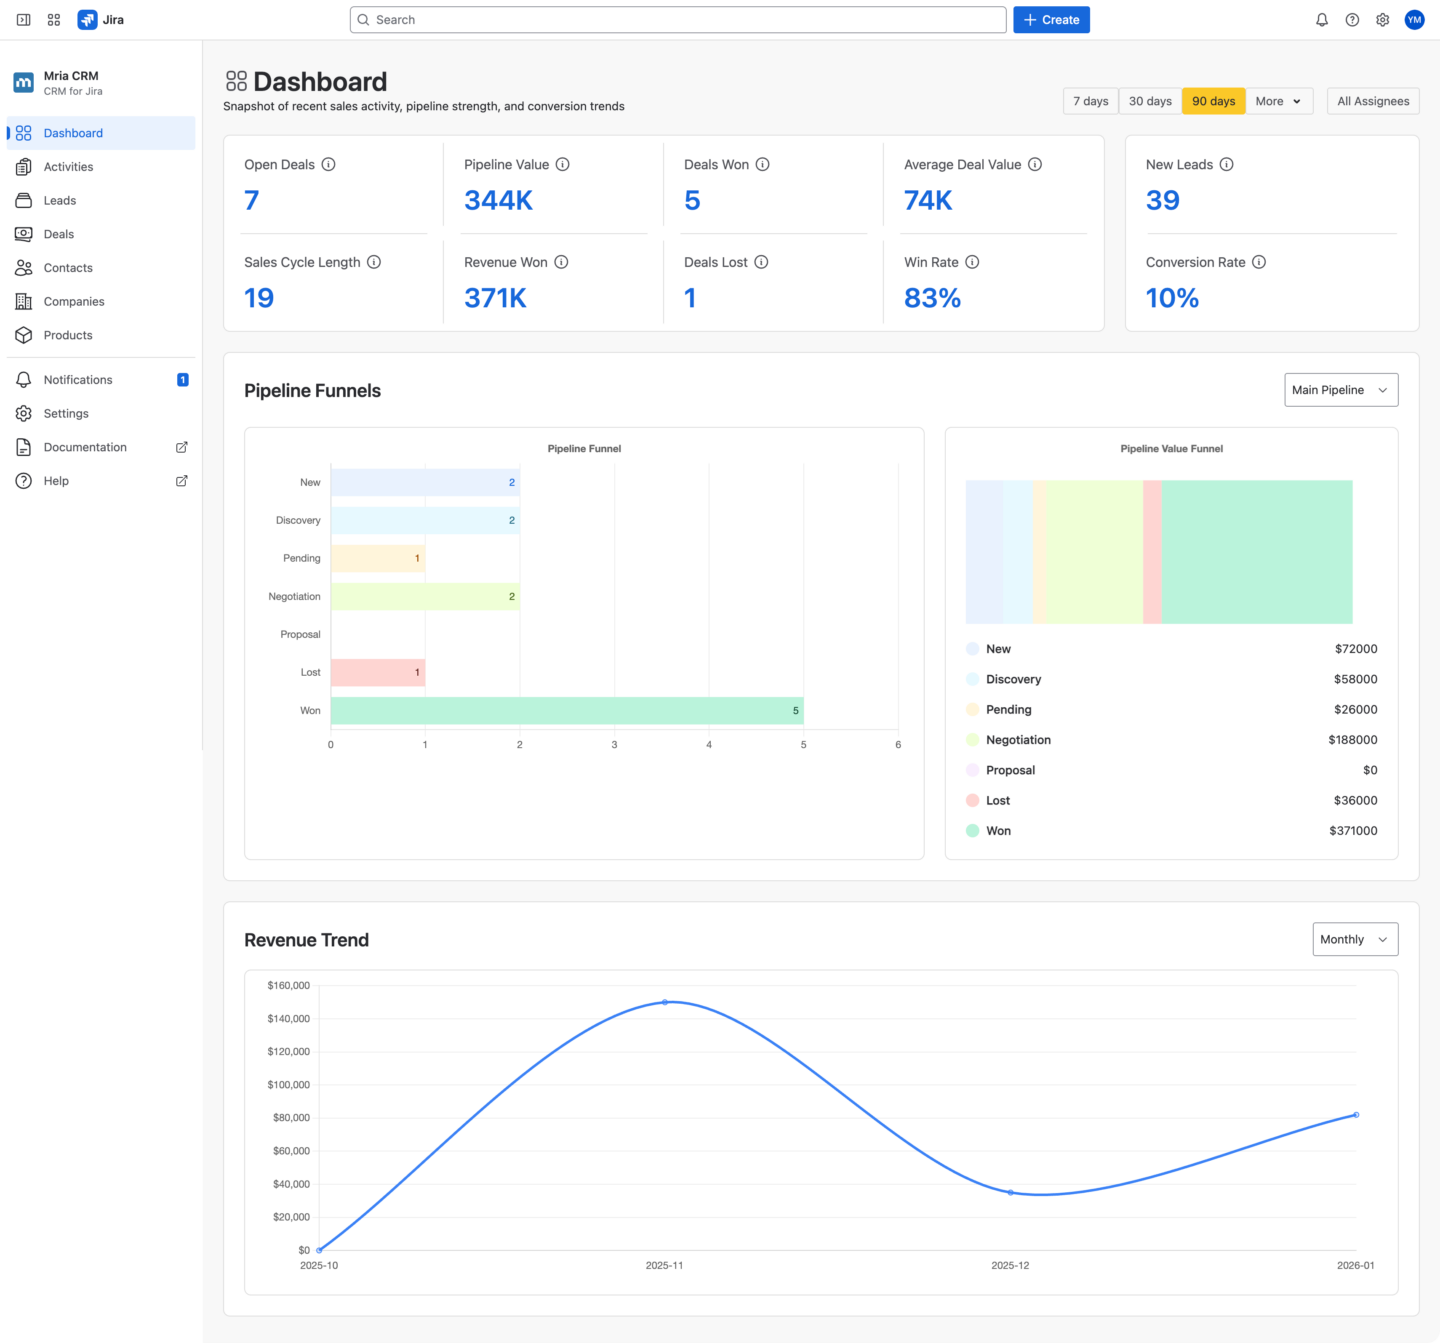
Snapshot Metrics: A Real-Time View of Sales Performance in Jira
The top section of the Dashboard presents a compact set of metrics that summarize both current exposure and recent outcomes.
This is not a random collection of KPIs. Each metric is there to eliminate a specific uncertainty.
Key Sales KPIs in Mria CRM for Jira
- Open Deals and Pipeline Value show how much business is currently in play
- Deals Won, Deals Lost, and Revenue Won show what actually closed
- Average Deal Value, Win Rate, and Sales Cycle Length show efficiency, not just volume
- New Leads and Conversion Rate connect lead creation to pipeline growth
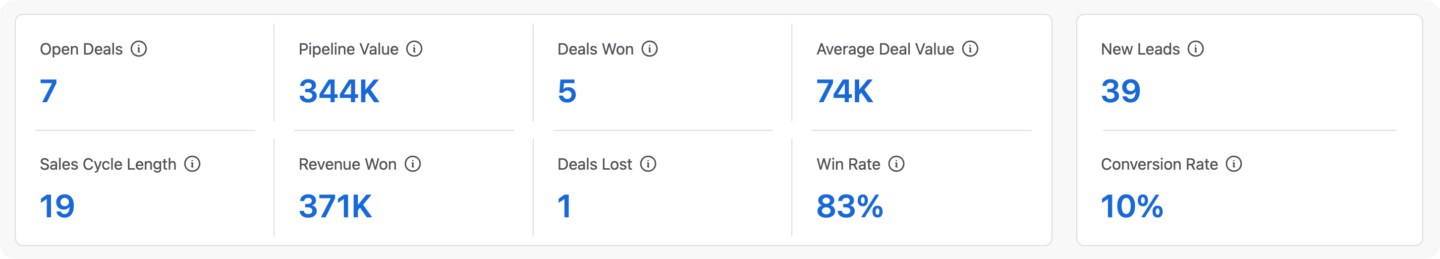
Some of these metrics always reflect the live pipeline state. Others respond to the selected time range.
Without this snapshot, teams usually piece together the same understanding by opening Leads or Deals lists, filtering Deals, or asking for updates. The snapshot replaces that effort with a shared reference point that works equally well for sales reps, managers, and leadership.
It becomes the starting point for every sales conversation.
Pipeline Funnels in Mria CRM: Sales Pipeline Visibility in Jira
The Pipeline Funnels section shows how Deals move through the actual sales stages defined in your Mria CRM pipelines. The Dashboard does not assume a single sales flow. If your team uses more than one pipeline (for example, different pipelines for products, regions, or sales motions) you can select the pipeline you want to analyze directly in the Dashboard.
This makes the funnels relevant not just for simple setups, but for real-world sales organizations with multiple pipelines.
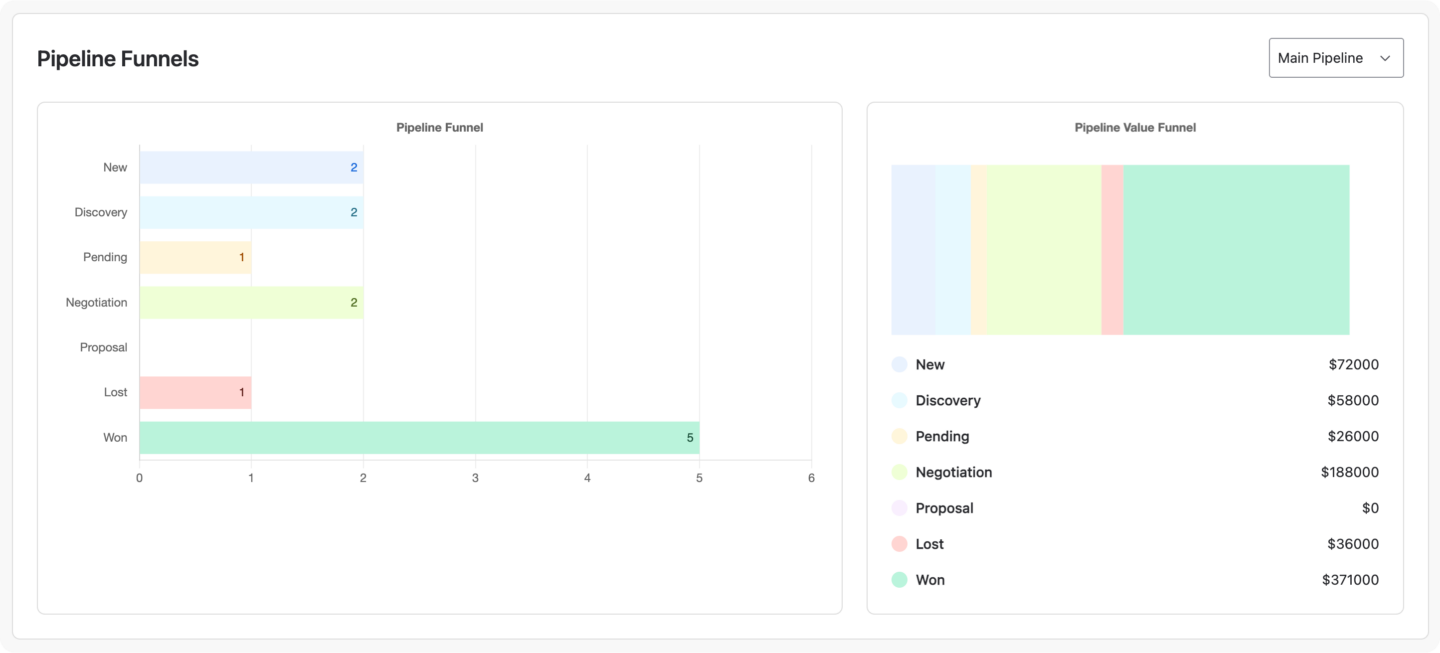
1. Pipeline Funnel: Deal Volume by Stage
This view shows how many Deals are currently in each pipeline stage. The Pipeline Funnel shows the number of Deals currently associated with each pipeline stage.
For example, you can immediately see:
- how many Deals are in Discovery
- how many reached Won
- how many were marked as Lost
- whether intermediate stages like Negotiation or Proposal are empty or overloaded
Because the funnel is stage-based, it reflects how your sales process actually works, not an abstract model.
This view makes it easy to spot structural issues:
- stages where Deals accumulate without progressing
- stages that are skipped entirely
- imbalance between early and late pipeline steps
Instead of asking “why are Deals not closing?”, teams can first see where they stop moving.
2. Pipeline Value Funnel
The Pipeline Value Funnel uses the same pipeline stages, but shows the total Deal value associated with each stage.
This often tells a very different story than Deal count alone.
For example:
- a stage may contain only a few Deals but represent most of the pipeline value
- large amounts of value may be sitting in Lost or stuck in early stages
- Won Deals may be numerous but relatively small in value
By separating Deal volume from Deal value, the Dashboard helps teams understand:
- where revenue risk is concentrated
- which stages deserve the most attention
- whether pipeline health looks good on the surface but hides value problems underneath
Together, the two funnels explain both how Deals move and where the money actually is.
Revenue Trend in Mria CRM: How Revenue Changes Over Time in Jira
The Revenue Trend section shows how revenue from Won Deals evolves over time inside Mria CRM.
Instead of presenting revenue as a single total for a selected period, the Dashboard visualizes revenue as a trend. This makes it easier to understand not just how much revenue was closed, but how it accumulated.
The chart is based entirely on Mria CRM data and reflects Deals marked as Won.
Time-Based Revenue View in Jira
The Revenue Trend can be viewed by:
- Daily
- Weekly
- Monthly
This allows teams to adjust the level of detail depending on the type of review they are doing.
For example:
- daily view helps identify spikes caused by individual Deals
- weekly view smooths short-term noise and highlights momentum
- monthly view supports higher-level planning and leadership reviews
The selected time grouping does not change the data itself, only how it is aggregated and displayed.
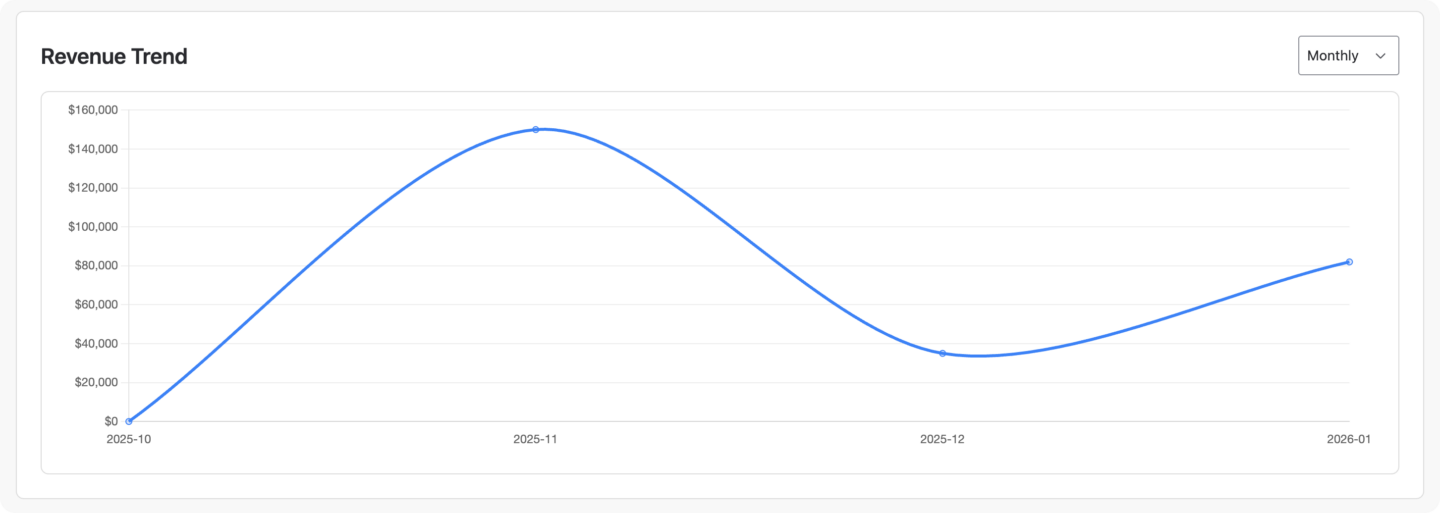
What the Revenue Trend Reveals
Looking at revenue as a trend makes several important patterns visible:
- whether revenue is consistent or uneven
- whether results depend on a small number of large Deals
- whether there are long gaps between closed Deals
- how revenue timing aligns with sales cycle length
These insights are difficult to see when revenue is reduced to a single number.
Filters for Sales Analysis in Mria CRM
The Dashboard in Mria CRM is designed to be flexible without becoming fragmented. Filters allow teams to adjust the view to different questions and review contexts, while the Compare option makes it possible to evaluate changes over time using the same structure and metrics. This ensures that analysis stays consistent, even when perspective changes.
Date Filters for Sales Analysis in Jira
The Dashboard supports a range of predefined and custom date options, such as:
- recent periods (for example, 7, 30, or 90 days)
- longer horizons like 6 or 12 months
- Year-To-Date (YTD)
- custom date ranges
Date filters affect metrics related to outcomes and trends, such as Deals Won, Revenue Won, Conversion Rate, and Revenue Trend, while metrics that represent the current pipeline state remain live and unaffected.
This distinction helps teams avoid mixing current exposure with historical results.
Assignee Filters for Individual and Team Views
The Assignee filter allows teams to focus on:
- a single sales representative
- a selected group of assignees
- or the entire team
With one click, the same Dashboard can be used for personal reviews, team pipeline discussions, or leadership-level overviews, without creating separate dashboards or reports.
Compare Periods to Understand Change Over Time
In addition to filtering, the Dashboard supports comparison between periods. When Compare is enabled, the Dashboard shows how key metrics and trends differ between two selected time ranges. This makes it possible to answer questions such as:
- how the performance of this period compare to the previous one
- whether conversion rates are improving or declining
- whether revenue growth is accelerating or slowing down
Because the comparison uses the same metrics and structure, changes are easy to interpret and discuss.
How This Changes Day-to-Day Work for Sales Teams in Jira
The Dashboard has a direct operational impact because it reduces ambiguity.
Sales reps work with clearer priorities
Reps can see where their Deals sit in the overall system, not just their own list. This helps them focus effort on Deals and stages that actually affect outcomes, instead of reacting to whatever feels urgent.
Managers run better pipeline reviews
Pipeline reviews no longer rely on manually prepared summaries or subjective explanations. Managers can see pipeline shape, value concentration, and conversion efficiency instantly, and intervene earlier when something is off.
Leadership stays connected to reality
Leadership gains continuous visibility into pipeline exposure, revenue outcomes, and trends without waiting for reports or external dashboards. Discussions about growth, risk, and forecasting are grounded in live Mria CRM data inside Jira.
Sales Performance Visibility in Jira with Mria CRM
With the introduction of the Dashboard, Mria CRM completes an essential part of running a CRM for Jira. Leads, Deals, pipeline stages, and revenue are not only managed inside Jira, but now also visible and understandable at a system level.
The Dashboard brings together pipeline state, stage distribution, conversion performance, revenue trends, and period comparison in one place. This allows sales teams, managers, and leadership to work from the same view of reality, using live CRM data inside Jira instead of fragmented reports or external tools.
For teams using Jira as a CRM, this closes the gap between execution and understanding.
The Dashboard is also the first step in the development of reporting in Mria CRM. We are actively working on expanding reporting capabilities, with additional dashboards and reports already in progress. Over time, this will enable more detailed analysis and deeper operational insight, while keeping all reporting inside Jira.
Get Started with the Mria CRM Dashboard
The Sales Dashboard is available now as part of Mria CRM.
- Install Mria CRM from the Atlassian Marketplace and explore the Dashboard inside Jira
- Use filters and comparison to review pipeline health, revenue trends, and performance changes
- Learn more about using Mria CRM, configuring pipelines, stages, and metrics in the Mria CRM documentation
The Dashboard works alongside Leads, Deals, Contacts, Companies, Products, and Activities, as part of a single, Jira-native sales CRM.